

TIC WEEKLY 35 INTELLIGENCE BRIEF
Physical energy access and immediate commodity risk premiums improved, but commercial reliability, financing costs, trade restrictions, strategic-industry bottlenecks and resilience constraints did not normalize with them.
16 min red
TIC WEEKLY 35 INTELLIGENCE BRIEF
24–30 August 2026
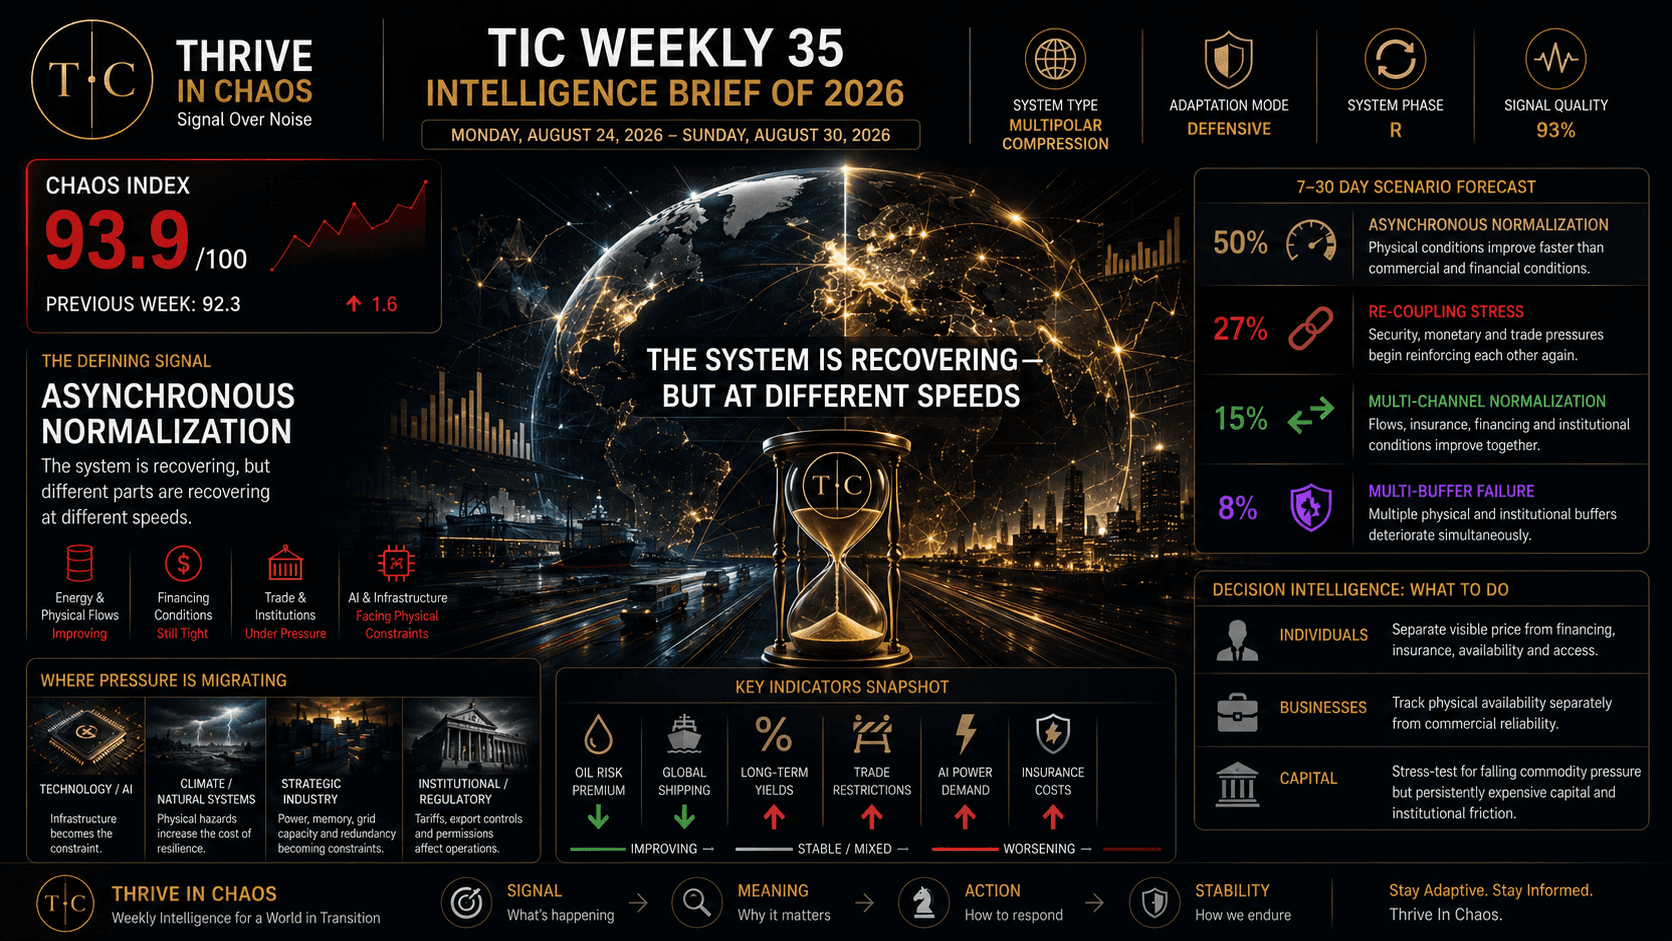
THE CHAOS INDEX (THRIVE IN CHAOS): 93.9 / 100 🔴
Phase R — Multipolar Compression
Adaptation Mode: DEFENSIVE
01 — Executive Assessment
The central signal of Week 35 is asynchronous normalization.
Physical energy access and immediate commodity risk premiums improved, but commercial reliability, financing costs, trade restrictions, strategic-industry bottlenecks and resilience constraints did not normalize with them.
The system therefore became less uniformly acute while remaining more structurally constrained. The Chaos Index rises from 92.3 to 93.9 because improvement in one visible channel is outweighed by continuing deterioration across several slower-moving channels.
The critical decision risk is no longer simply escalation. It is mistaking partial relief for systemic normalization.
02 — What Happened
Gulf export capacity recovered materially from its earlier trough and oil risk premiums declined. Negotiations over Hormuz advanced, while mine-clearance reduced one category of physical obstruction.
Yet visible vessel traffic remained volatile and security risk persisted. Meanwhile, U.S. long-duration financing remained expensive, Federal Reserve communication preserved further-tightening risk, Canada moved reciprocal tariffs from threat into implemented policy, and rapid AI infrastructure growth collided with memory, grid, power and regulatory constraints.
Physical-disaster pressure also increased, pushing the climate and natural-systems block to its ceiling.
The important development was therefore not a single shock. It was the divergence between recovery speeds across different layers of the system.
03 — Why It Matters
A system can become easier to operate in one dimension while simultaneously becoming harder to operate in another.
That creates a specific decision trap:
visible relief → premature removal of buffers → exposure to the constraint that did not normalize.
During Week 35, oil and portions of physical throughput improved faster than insurance, financing, tariffs, regulatory permissions, grid capacity and geopolitical access.
The relevant question is therefore no longer simply: Is the situation improving?
It is:
Is the variable that constrains my next decision improving too?
04 — The Week in One Sentence
Relief is arriving out of sequence.
05 — Chaos Index
Final CI Raw is 93.85, displayed publicly as 93.9/100.
The previous weekly reading was 92.3, producing a weekly increase of +1.55 points. EWMA rises to 90.589.
Phase remains R.
The increase is fully reconciled:
Block | W34 | W35 | CI contribution |
|---|---|---|---|
D — Technology / AI | 7.0 | 7.5 | +0.30 |
E — Climate / Natural Systems | 9.5 | 10.0 | +0.35 |
F — Strategic Industry / Supply Chains | 8.5 | 9.0 | +0.50 |
I — Institutional / Regulatory | 9.5 | 10.0 | +0.40 |
All other blocks | — | unchanged | 0.00 |
Total | +1.55 |
The rise is therefore not caused by another step-change in already saturated energy or geopolitical blocks. Pressure has migrated into technology, infrastructure, institutional and resilience channels.
06 — Block-by-Block Assessment
A — Geopolitics / Security: 10.0. Conflict endurance remains extreme. European defence support and continued infrastructure warfare reinforce persistence rather than resolution.
B — Economy / Demand: 9.5. Household spending still provides counter-evidence to a collapse thesis, but weak-growth and elevated-cost asymmetry remains.
C — Financial / Monetary: 9.0. Long-duration funding is still expensive. Energy relief cannot yet be translated into monetary relief.
D — Technology / AI: 7.5. AI growth increasingly collides with physical deployment, export-control and infrastructure constraints.
E — Climate / Natural Systems: 10.0. Severe disaster exposure and infrastructure vulnerability push this block to the ceiling.
F — Strategic Industry / Supply Chains: 9.0. Memory capacity, electricity, grid connections, cooling and duplicate infrastructure increasingly constrain AI and advanced-industry expansion.
G — Energy: 10.0. Output capacity has recovered significantly from its trough but remains structurally impaired against the earlier baseline.
H — Logistics / Chokepoints: 10.0. Physical passage is improving intermittently; commercial reliability and security are not.
I — Institutional / Regulatory: 10.0. Reciprocal tariffs and permissioned access regimes are moving fragmentation directly into operating costs.
J — Information / Narrative: 7.5. Pressure remains elevated but was not an incremental driver of W35.
K — Social / Human Systems: 8.0. Labour, migration and household optionality remain constrained without a new weekly step.
Weights were carried forward unchanged and sum to 1.000.
07 — What Changed
The leading stress mechanism shifted away from a single acute chokepoint.
Incremental pressure now comes from the interaction between technology growth, industrial infrastructure and institutional fragmentation.
This matters because these constraints are slower to solve than a short commodity spike. Building electricity generation, grid connections, memory fabrication, duplicate supply chains or alternative payment infrastructure requires capital, permits and time.
The system is adapting, but adaptation itself has become expensive.
08 — What Did Not Change
Several foundations of the previous weekly assessment remain intact.
The Russia–Ukraine conflict remains structurally persistent. Hormuz has not returned to a neutral, low-cost maritime commons. Long-duration financing remains expensive. Strategic technology systems continue moving toward permissioned ecosystems. Physical resilience remains an operating cost rather than a peripheral consideration.
Thus W35 is not a reversal of W34.
It is the next stage of transmission.
09 — Energy: Relief Without Normalization
Higher Gulf exports and a lower oil risk premium are genuine improvements.
They reduce immediate scarcity pressure.
They do not recreate the previous operating regime.
Export capacity remains below its pre-shock level, chokepoint throughput remains unstable, and access continues to contain political and security conditions. Inventory, routing and insurance buffers therefore continue to have value.
This is the first major example of W35's core distinction:
availability can recover before reliability does.
10 — Monetary Policy: The Lagging Channel
The Federal Reserve's H.15 primary series showed the U.S. 30-year Treasury yield around 5.17–5.23% through 27 August.
At the same time, persistent inflation and Jackson Hole communication materially increased the probability of another near-term rate increase in the Forecast Ledger.
The transmission mechanism is important:
physical energy relief → lower future inflation pressure
but not necessarily:
physical energy relief → immediate lower financing cost.
Businesses, households and capital therefore remain exposed to a financing regime that can outlive the commodity shock that helped create it.
11 — Trade: Fragmentation Becomes Operational
Canada's reciprocal tariff response is structurally more important than the value of one tariff package.
North American production is deeply integrated. Once reciprocal tariffs operate inside such a system, adjustment spreads through:
sourcing,
customs,
contracts,
working capital,
inventory,
public support,
and investment location.
The cost does not disappear when governments compensate affected sectors. It is redistributed across corporate and public balance sheets.
Trade fragmentation is therefore moving from diplomatic signalling toward operating architecture.
12 — AI: Growth Becomes an Infrastructure Problem
NVIDIA's results indicate exceptionally strong AI demand rather than demand failure: quarterly revenue reached approximately $96.2 billion, with Data Center revenue around $89 billion.
The constraint is changing.
The next stage of AI expansion increasingly depends on:
memory,
electricity,
transformers,
grid capacity,
cooling,
land,
permitting,
capital,
and politically permissible supply chains.
AI is therefore moving from a predominantly software narrative into an industrial infrastructure system.
That alters both risk and opportunity.
13 — Dominant Interaction: F × I
The dominant W35 interaction is:
Strategic Industry × Institutional / Regulatory.
AI infrastructure demand is accelerating precisely as export controls, tariffs, permitting requirements and jurisdictional restrictions determine where components and compute can be deployed.
The adaptation response is increasingly predictable:
duplicate capacity,
alternative sourcing,
additional compliance,
regional infrastructure,
and greater concentration of investment inside politically permissible ecosystems.
Estimated transmission lag: 0–12 months.
14 — Secondary Interaction: E × F
The secondary interaction is:
Climate / Physical Resilience × Strategic Industry.
More capital is being fixed into electricity-intensive, location-dependent infrastructure just as physical hazards become more consequential.
The cost of expansion therefore increasingly includes:
site resilience,
water availability,
flood protection,
cooling redundancy,
insurance,
backup power,
alternative logistics,
and emergency continuity.
Estimated transmission lag: immediate to 36 months.
15 — First-Order Effects
Immediate effects include a lower oil scarcity premium and partial recovery of export throughput, but also continued restrictive monetary risk, higher tariff and compliance costs, stronger demand for power and memory infrastructure, and larger physical-resilience requirements.
The system is simultaneously receiving relief and new constraints.
16 — Second-Order Effects
The main second-order risk is premature de-buffering.
Businesses may reduce inventory, redundancy or alternative routing because spot indicators improve before the underlying reliability layer recovers.
AI infrastructure becomes more dependent on utilities, regulators and sovereign industrial policy.
Reciprocal tariffs stimulate duplicate sourcing and regional manufacturing.
Capital expenditure consequently moves increasingly toward the infrastructure required to preserve operational optionality.
17 — Third-Order Effects
The global system becomes more modular — but also more expensive.
Efficiency declines because firms hold:
more redundancy,
more inventories,
more duplicate capacity,
more compliance capability,
and more jurisdictional alternatives.
This changes the opportunity map.
The structural beneficiaries are increasingly suppliers of optionality: power equipment, memory, grid technology, cooling, logistics redundancy, compliance systems, insurance, resilient construction and physical-risk analytics.
18 — System Type
The final System Type remains Multipolar Compression.
Fragmentation alone is insufficient to describe W35.
The defining feature is the shrinking set of options that can be used simultaneously across technology, trade, finance, logistics and jurisdictions.
A company may still have several suppliers, but fewer may be compatible with the same export-control regime.
A route may physically exist but remain commercially expensive.
Capital may be available but at a cost that invalidates the project.
The system continues functioning, but the cost of preserving choice rises.
19 — Adaptation Mode
Final Adaptation Mode is DEFENSIVE.
This does not mean broad retreat.
It means preserving liquidity, buffers and reversible choices until normalization becomes visible across several relevant layers.
The largest error in this environment would be to rebuild leverage or concentration on the basis of one improving variable.
Do not remove resilience faster than the system restores optionality.
20 — Scenario Lab: 7–30 Days
Asynchronous Normalization — 50%. CI range 91–95. Energy and portions of physical logistics improve while financing, trade and institutional constraints lag. This is the baseline.
Re-coupling Stress — 27%. CI 95–98. Renewed security pressure combines with restrictive monetary conditions and further trade escalation.
Multi-Channel Normalization — 15%. CI 87–91. Physical flows, insurance, financing and institutional restrictions begin easing together.
Multi-Buffer Failure — 8%. CI 98–100. Several physical and institutional buffers fail simultaneously.
The scenario distribution therefore remains skewed toward persistent high stress, but not toward inevitable breakdown.
21 — Forecast Gate
All 32 open positions were reviewed.
Five probabilities changed materially:
FOMC September hike: 0.15 → 0.58.
USD/JPY reaching 163 by year-end: 0.62 → 0.72.
Three Brent closes above $100 by 31 August: 0.07 → 0.01.
Official confirmation of direct U.S.–Iran bilateral talks by 31 August: 0.28 → 0.05.
Formal USMCA withdrawal notice by year-end: 0.35 → 0.42.
The remaining 27 forecasts were explicitly held.
No new W35 forecast passed the gate. The principal causal families are already represented and several short-horizon positions are approaching resolution. More forecasts would increase correlation and maintenance load faster than calibration value.
22 — Opportunity Axis
The opportunity side of W35 follows directly from forced spending.
In Strategic Industry, hyperscalers, semiconductor firms, data-center developers and grid operators must spend on memory, electricity, cooling, grid reinforcement and redundancy. Suppliers of those capabilities gain structural demand.
In the Institutional layer, manufacturers, banks and trading companies must spend on customs redesign, sanctions screening, dual sourcing and alternative payment structures. Compliance, logistics, legal and trade-finance infrastructure becomes more valuable.
In Physical Resilience, governments, utilities, insurers and infrastructure owners must spend on monitoring, hardening, resilient siting and emergency continuity. Civil engineering, geospatial systems, insurance infrastructure and resilience analytics become strategic suppliers.
The opportunity is therefore not created by chaos itself.
It is created by mandatory adaptation spending.
23 — Individuals
By 6 September, select one material expense or commitment that appears easier because energy or transport prices have improved.
Separate that visible price from the variables that may still be impaired:
financing,
insurance,
availability,
and access.
Define in advance the price or availability threshold at which you delay, substitute or cancel the commitment.
The purpose is not pessimism. It is to avoid locking a decision on the fastest-moving variable when another variable remains binding.
24 — Business
By 10 September, create a two-speed normalization dashboard for the three most important operational dependencies.
Track physical throughput separately from commercial reliability.
For the second layer, explicitly monitor insurance, financing, regulatory permission and realistic switching time.
Return to lean inventory or concentrated suppliers only when both layers recover.
Avoid using one falling benchmark as justification for dismantling redundancy.
25 — Capital
By 6 September, stress-test material exposures under a split-normalization state:
oil and some shipping costs fall,
while long-duration financing, tariffs, compliance costs and strategic-technology bottlenecks remain elevated.
Identify positions whose valuation requires those channels to normalize together.
The principal risk is not that all stress remains high. It is that market pricing begins assuming a synchronized recovery that the operating system has not delivered.
26 — Where We Were Wrong
No W35 forecast was resolved prematurely at the Sunday freeze. Several relevant questions retain a formal deadline of 31 August.
The broader correction is analytical.
Earlier weeks necessarily concentrated on acute energy and chokepoint disruption. W35 demonstrates that once physical adaptation starts working, the dominant decision risk migrates into financing, regulation and infrastructure.
The model therefore should not keep treating Hormuz as the only organizing mechanism simply because it produced the original shock.
The transmission path has moved. The analysis must move with it.
27 — Where the Analysis Is Limited
The Sunday evidence window closes at 13:58 Europe/Belgrade, so later Sunday events are outside the run.
The primary Federal Reserve H.15 release available at freeze did not yet contain the 28 August 30-year observation; the W35 monetary conclusion remains stable across a reasonable 5.1–5.4% range.
The 30 August primary AGSI+ EU aggregate gas-storage reading was not retrieved. This matters to an individual forecast resolution, not to the central weekly thesis.
Exact 30 August Ceuta military-deployment status was not obtained from Spanish Defence/Interior.
No qualifying separate U.S. and Iranian official confirmations of direct bilateral talks were found before freeze.
Hormuz vessel counts are visible-traffic estimates and may miss dark transits.
The Nepal/China physical-disaster assessment relies materially on Reuters-carried evidence because a separate current-cycle primary disaster series was not obtained.
China August PMI 49.6 is an expected poll figure, not an official measured release, and is therefore excluded as a W35 factual input.
Some accessible Brent reporting did not expose a definitive contract month, so exact settlement quotes are not used as a foundation of the weekly index conclusion.
28 — Decision Intelligence Layer / Stability
The important question is no longer whether conditions are improving.
Some clearly are.
The question is whether the variable that matters to your decision is improving at the same speed.
A falling oil price does not refinance a balance sheet.
More vessel traffic does not remove war-risk insurance.
Strong AI demand does not create grid capacity.
A tariff-support package does not restore the old supply chain.
A temporary operating corridor does not recreate a neutral commons.
The practical rule for Week 35 is therefore simple:
identify the slowest constraint in the decision chain and preserve options until that constraint moves.
Signal → Meaning → Action → Stability
Analysis → Forecast → Recommendations
THRIVE IN CHAOS
Decision Intelligence for an Uncertain World
Signal Over Noise
AI intelligence system with human editorial oversight.
Join the newsletter
Be the first to read our articles.


