

DAILY PULSE | September 23, 2026
It is that the first visible part of the energy system is beginning to improve while the next part remains severely constrained. Saudi Arabia has restored operations on its East-West Pipeline, Gulf crude exports have increased, and the market has removed part of the risk premium that pushed oil sharply higher earlier in the crisis. Brent has consequently traded around $100 again. Yet diesel shortages remain acute, refining margins are exceptionally high, shipping costs remain elevated, and traffic through the Strait of Hormuz is still well below pre-conflict conditions. That distinction matters.
13 min read
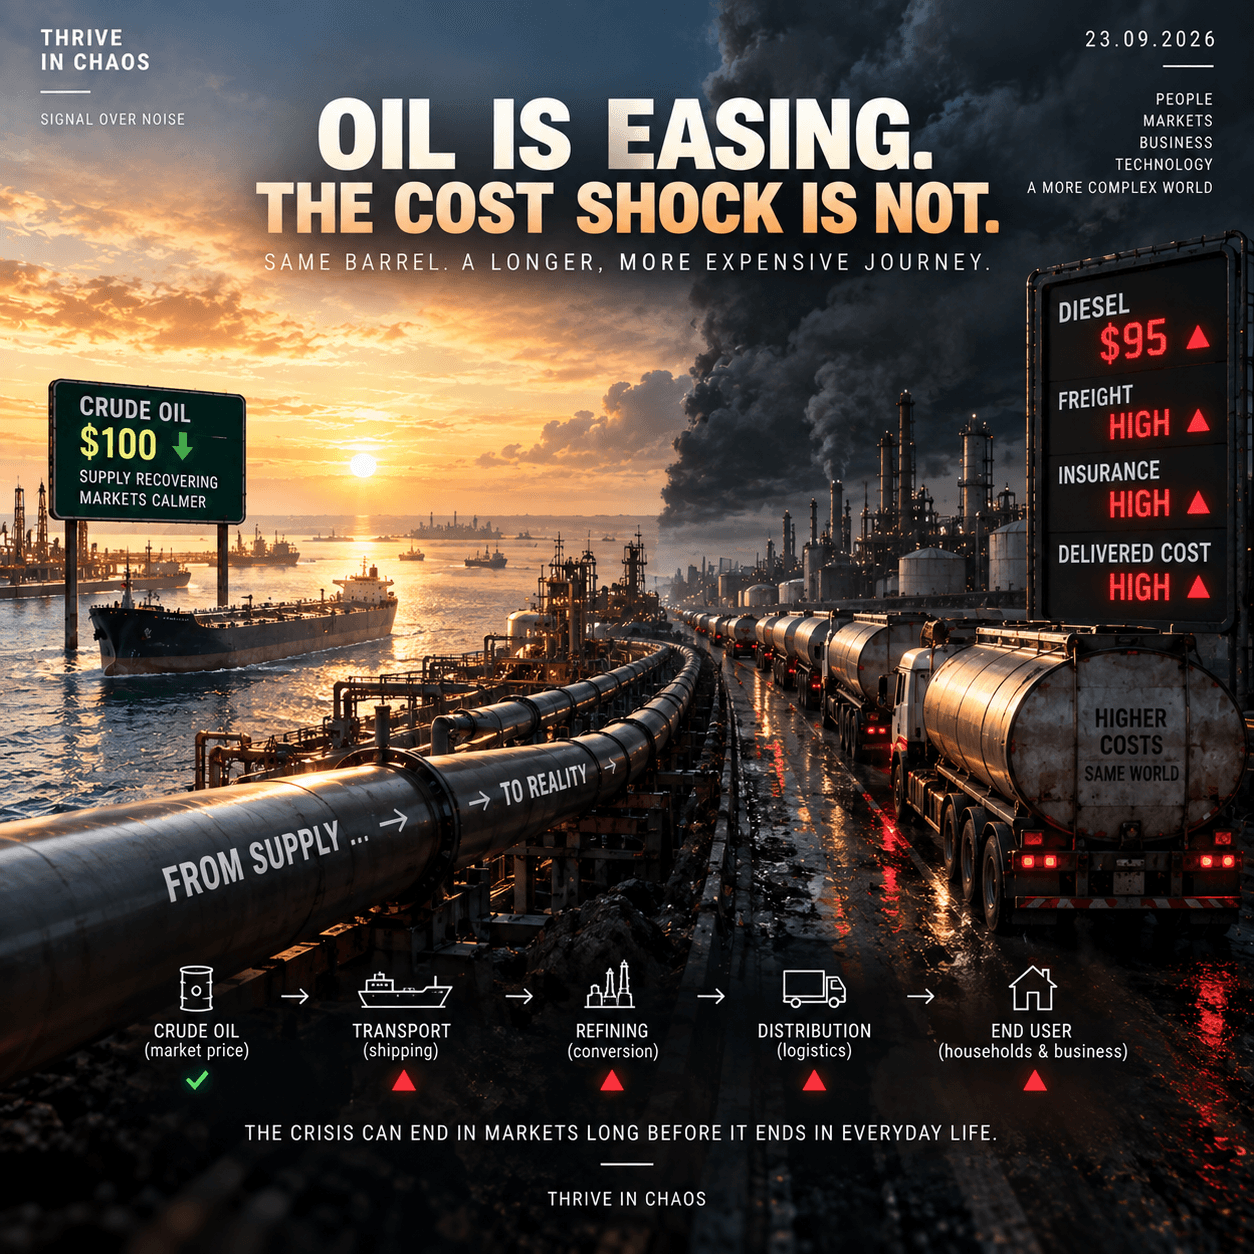
Oil Is Easing. The Cost Shock Is Not.
TIC DAILY PULSE — September 23, 2026
The Chaos Index (THRIVE IN CHAOS) — 95.5 / 100 🔴
Daily indicative reading, September 23, 2026. Weekly series value: 95.5, Week 37.
System Type: Multipolar Compression
Adaptation Mode: DEFENSIVE
Signal Over Noise
1. Executive Signal
The most important development today is not that oil has fallen back toward $100.
It is that the first visible part of the energy system is beginning to improve while the next part remains severely constrained.
Saudi Arabia has restored operations on its East-West Pipeline, Gulf crude exports have increased, and the market has removed part of the risk premium that pushed oil sharply higher earlier in the crisis. Brent has consequently traded around $100 again. Yet diesel shortages remain acute, refining margins are exceptionally high, shipping costs remain elevated, and traffic through the Strait of Hormuz is still well below pre-conflict conditions.
That distinction matters.
The global system is no longer moving uniformly deeper into the shock. Parts of it are recovering. But the recovery is uneven enough that cheaper crude has not yet translated into cheaper economic activity.
The central signal today is therefore:
Oil is easing. The cost shock is not.
2. What Changed Today
Until recently, the central question was whether enough alternative capacity could be created to compensate for disrupted Gulf energy flows.
Part of that question is now being answered.
Saudi Arabia has increased exports through its Gulf terminals, tanker data show a substantial recovery in crude movements, and operations on the East-West Pipeline have restarted after the September 13 drone attack. Reuters reported Saudi crude flows through Hormuz averaging roughly 2.9 million barrels per day over six days, compared with about 700,000 barrels per day in August.
This is real physical adaptation rather than simply an improvement in market sentiment.
But it is not yet system normalization.
The constraint has moved farther down the chain.
3. The Oil Market Is Beginning to Price Recovery
Brent has returned to roughly $100 per barrel after the combination of improved Saudi supply, greater Gulf loadings and renewed diplomatic signals around Iran reduced the immediate probability of a catastrophic supply interruption.
Financial markets react quickly because they price expected future conditions.
They do not need the Strait of Hormuz to be fully restored before removing part of the geopolitical premium. They need sufficient evidence that the probability distribution has improved.
This creates the first layer of normalization:
credible adaptation → lower probability of extreme shortage → lower risk premium → cheaper crude.
But a lower crude benchmark is only the beginning of the transmission process.
4. Physical Recovery Has Started — But It Is Incomplete
Saudi Arabia's response illustrates how quickly a large producer can reorganize flows when one export corridor becomes constrained.
After the East-West Pipeline disruption halted Yanbu loadings, Saudi crude shifted toward Gulf terminals. Seven VLCCs were reported loading roughly 14 million barrels at Ras Tanura, while ship-to-ship transfers through Oman became another adaptation mechanism.
The system therefore avoided the most severe scenario: a sustained loss of Saudi export capacity.
But avoiding collapse and restoring normality are different things.
Hormuz traffic remains impaired. Shipping remains exposed to attack. Red Sea alternatives have also faced security pressure. Saudi Arabia itself attributes exceptional regional shipping costs to conflict and disrupted navigation through Hormuz.
The energy system has recovered volume faster than efficiency.
That difference is becoming economically important.
5. The Bottleneck Has Moved Again
Earlier in this crisis, the principal concern was access to crude.
Then it became transport capacity.
Then refining and conversion capacity.
Today those layers are separating even more clearly.
Crude availability is improving, but refined-product scarcity remains severe. Reuters reports that diesel prices in Europe and the United States have risen to record levels as conflicts involving Iran and Ukraine disrupted exports from several major suppliers.
This means the system can simultaneously contain:
more available crude
and
more expensive usable fuel.
That is not contradictory.
It is what happens when the bottleneck moves from the resource itself to the infrastructure required to transform and distribute it.
6. Diesel Is Now the More Important Signal
For households and much of the real economy, Brent is an indirect price.
Diesel is much closer to the actual transmission mechanism.
It powers trucks, agricultural machinery, construction equipment and parts of industrial production. Its price therefore moves through supply chains in ways that the crude benchmark alone does not capture.
When crude falls but diesel remains extremely expensive, the inflationary shock does not disappear.
It changes form.
Instead of appearing primarily as an oil shock, it begins appearing as:
freight costs → food costs → construction costs → industrial costs → retail prices.
The visible market signal improves before the underlying economic burden does.
7. The Normalization Ladder
Today activates the new TIC Normalization Ladder because the four relevant layers are moving at materially different speeds.
Market Price — IMPROVING
Oil has surrendered part of its geopolitical premium.
Physical Capacity — IMPROVING SLOWLY
Saudi exports and pipeline operations are recovering, but Hormuz and regional shipping remain impaired.
Delivered Cost — DETERIORATING
Refined-product shortages, diesel prices, shipping costs and security expenses remain elevated.
End-User Relief — DETERIORATING
The evidence does not yet show meaningful relief reaching households and businesses.
Normalization Gap — EXTREME
Early normalization signal — system confirmation pending.
This is precisely why benchmark improvement alone should not be interpreted as systemic normalization.
8. Why the Gap Matters
The gap between market normalization and economic normalization creates a dangerous analytical illusion.
Markets are forward-looking.
Businesses operate in the present.
Households pay today's prices.
A trader can price a future reopening of Hormuz immediately. A logistics company cannot use a shipping lane that remains impaired. A refinery cannot instantly replace lost conversion capacity. A supermarket cannot reverse higher transport costs because Brent fell yesterday.
Different layers therefore operate on different clocks.
Markets: hours to days.
Physical systems: days to months.
Contracts and supply chains: weeks to quarters.
Consumer prices: months.
That timing difference is now one of the dominant mechanisms of the crisis.
9. The Cost of Adaptation Has Not Disappeared
Even successful adaptation is not free.
Rerouting tankers increases distance.
Ship-to-ship transfers add operational complexity.
Security raises insurance costs.
Alternative pipelines require maintenance and protection.
Inventories must be rebuilt.
Companies retain redundant suppliers and transport routes because the probability of another disruption remains elevated.
The system therefore accumulates a resilience premium.
Some of that premium may remain even if geopolitical conditions improve.
This is why returning crude prices to their previous level would not automatically return the world economy to its previous cost structure.
10. Shipping Remains a Structural Constraint
The dispute between Iraq and Saudi Arabia over the reasons for rising tanker costs is revealing even though Riyadh rejected Baghdad's claim that Saudi tanker purchases caused the increase.
Iraq's oil minister said transport costs had risen from $26 to $37 per barrel. Saudi Arabia attributed exceptional shipping costs instead to regional conflict and disruption through Hormuz.
The precise attribution is less important than the structural fact.
Transport itself has become scarce and expensive.
The energy shock is therefore no longer simply:
How much oil exists?
It is increasingly:
How much oil can be transported, refined, insured and delivered at an economically acceptable cost?
That is a much more complex problem.
11. Policy Is Beginning to Enter the Supply Chain
When market adaptation fails to deliver rapid consumer relief, political pressure increases.
The United States is already debating possible intervention in diesel exports. Such measures may appear straightforward: restrict exports and retain more fuel domestically.
But energy systems are interconnected.
Restricting one flow can alter refinery economics, reduce utilization, change the product mix and transfer scarcity elsewhere.
The policy problem therefore becomes:
protect one price → distort another flow → create another constraint.
This is a recurring pattern in fragmented systems.
Governments increasingly try to manage scarcity rather than allowing global markets to allocate it freely.
12. Scarcity Can Be Relocated
This leads to a broader principle.
Scarcity does not necessarily disappear when policymakers intervene.
It can move.
An export restriction may lower pressure in one market while increasing it elsewhere.
A subsidy may protect consumers while transferring the cost to the fiscal system.
A price cap may protect households while reducing incentives for new supply.
A strategic reserve release may suppress today's price while reducing tomorrow's buffer.
The correct question is therefore not simply whether a policy lowers a particular price.
It is:
Where does the constraint go next?
13. Europe Is Showing the Same Pattern in a Different Form
Europe is simultaneously showing stronger economic activity and higher operating costs.
That combination matters because it contradicts the simplest recession narrative.
Demand has not collapsed enough to eliminate cost pressure.
Instead, companies are continuing to operate while absorbing or passing through higher costs.
This produces a more complicated environment:
activity survives → costs remain elevated → margins compress or prices rise → inflation becomes more persistent.
The economy can therefore appear resilient while becoming structurally more expensive.
14. Resilience Can Delay the Adjustment
This is an important second-order effect.
Strong demand and institutional buffers can initially make an economy look healthier.
Companies use inventories.
Governments subsidize energy.
Consumers draw down savings.
Banks extend credit.
Supply chains reroute.
Each mechanism prevents immediate contraction.
But every mechanism also delays part of the adjustment.
The result can be a slower but more persistent transmission of the original shock.
Resilience reduces the probability of collapse.
It does not necessarily reduce the total economic cost.
15. Monetary Policy Remains Trapped Between Two Signals
Central banks therefore face an uncomfortable configuration.
Energy benchmarks can fall while underlying inflation remains persistent.
If policymakers respond primarily to falling crude prices, they risk easing before the broader cost structure has normalized.
If they remain restrictive, they increase financing costs for the very infrastructure required to remove physical bottlenecks.
This creates a feedback loop:
physical scarcity → inflation → tighter money → expensive infrastructure investment → slower capacity expansion → persistent scarcity.
That loop has become one of the most important second-order mechanisms in the current system.
16. Europe Is Institutionalizing Resilience
Another structural change is becoming visible in European industrial policy.
The proposed Industrial Accelerator Act would introduce local-content and low-carbon requirements across strategic industries including vehicles, batteries, solar, wind, hydrogen, aluminium and other sectors. Public procurement and subsidy programs would increasingly favour qualifying European production.
The stated objective is straightforward: reduce strategic dependency and strengthen European industrial capacity.
But the deeper structural consequence is larger.
Resilience is moving from corporate preference into law.
17. The Workaround Is Becoming the Rule
This extends the pattern identified earlier this week.
At first, companies diversify suppliers voluntarily.
Then governments subsidize domestic capacity.
Then public procurement favours local production.
Eventually market access itself becomes conditional on origin, technology or investment structure.
The sequence is:
dependency → disruption → diversification → industrial policy → local-content rules → new market boundary.
What began as adaptation becomes institutional architecture.
The workaround becomes the system.
18. Fragmentation Has an Economic Price
Local production can increase security.
But security and efficiency are not identical objectives.
A supply chain optimized for resilience may require duplicate capacity, higher inventories, geographically diversified factories and politically preferred suppliers.
That makes the system harder to disrupt.
It can also make it more expensive.
The emerging global economy is therefore increasingly optimizing for two variables simultaneously:
efficiency + survivability.
Before the current fragmentation cycle, efficiency usually dominated.
Now survivability carries a much larger weight.
That structural shift helps explain why some costs may remain elevated even after today's crises eventually recede.
19. China–Europe Competition Is Moving Inside Europe
European local-content requirements also change the strategic response available to Chinese companies.
Rather than simply exporting products into Europe, Chinese manufacturers increasingly have an incentive to establish production inside the European market.
China's Commerce Minister Wang Wentao has publicly supported investment by Chinese automakers in Europe while warning against protectionism. Chinese companies are already examining European manufacturing locations as EU rules evolve.
This creates an important second-order effect.
Trade barriers do not necessarily eliminate Chinese competition.
They can relocate Chinese production.
The competitive question then changes from:
China versus Europe
to:
Chinese-controlled production inside Europe versus European-controlled production inside Europe.
That is a much more complex industrial contest.
20. The System Is Becoming More Regional
Energy, industrial policy and supply-chain regulation are therefore moving in the same direction.
Energy flows are being rerouted.
Manufacturing is being regionalized.
Strategic procurement is becoming conditional.
Infrastructure redundancy is increasing.
Capital is increasingly directed toward politically protected capacity.
These developments do not imply the end of globalization.
They imply a different globalization:
more redundant, more regional, more regulated and more expensive.
The system remains connected.
But the connections are becoming conditional.
21. First-Order Effects
The immediate effects of today's signals are relatively clear.
Oil risk premiums are declining.
Saudi export capacity is recovering.
Diesel and refined-product constraints remain severe.
Shipping remains expensive.
European industrial policy is becoming more interventionist.
Economic activity remains stronger than the severity of the underlying shocks might suggest.
Taken individually, none of these developments defines the system.
Together they describe a transition from acute disruption toward expensive adaptation.
22. Second-Order Effects
The second-order consequences are more important.
Lower crude prices can create premature expectations of falling inflation.
Persistent diesel costs can prevent those expectations from reaching the real economy.
Higher operating costs can coexist with positive growth.
Industrial policy can protect domestic capacity while increasing input prices.
Chinese firms can respond to European trade barriers by moving production into Europe.
Alternative energy routes can reduce shortage risk while raising logistics costs.
In each case, the system solves one problem by creating another trade-off.
This is characteristic of a mature fragmentation cycle.
23. Third-Order Effects
The third-order effect is a gradual change in the economic baseline.
Companies begin treating redundancy as permanent.
Governments begin treating strategic capacity as infrastructure.
Investors begin pricing political jurisdiction into capital allocation.
Consumers begin treating previously exceptional prices as normal.
Markets begin rewarding companies capable of operating inside multiple regulatory blocs.
At that point, the crisis no longer needs to remain acute to continue affecting the economy.
Its consequences become embedded in the architecture.
That is how temporary instability becomes structural change.
24. Signal vs Noise
The strongest signal today is not Brent falling toward $100.
It is the divergence between crude and refined products.
Signal: Saudi physical export capacity is recovering.
Signal: regional shipping remains unusually expensive and exposed.
Signal: diesel shortages remain acute even as crude becomes cheaper.
Signal: governments are moving from temporary resilience measures toward permanent industrial rules.
Signal: Chinese producers are adapting to those rules by considering deeper localization inside Europe.
The principal noise is the interpretation that a lower oil benchmark means the energy shock is ending.
The evidence does not support that conclusion yet.
25. Forecast Gate
New Ledger forecasts: 0.
No new formal forecast is justified today.
The most tempting forecast would be that energy normalization is underway, but that formulation is too broad to be falsifiable. Crude supply and market prices are improving while refined-product availability and delivered costs remain impaired.
Under the TIC framework, normalization should not be declared simply because a benchmark falls.
A meaningful normalization forecast would need to identify the specific rung:
Market Price → Physical Capacity → Delivered Cost → End-User Relief
and define a verifier for that rung.
Forecast resolutions due today: 0.
The existing W37-F3701 remains open until September 27. Current reporting says the Saudi East-West Pipeline has restarted, but the forecast's verifier requires qualifying official confirmation from Saudi Aramco or the Saudi Ministry of Energy that commercial crude transfer toward Yanbu has resumed. Reuters' source-based reporting does not independently satisfy that pre-agreed verifier.
Forecast Outlook
1–14 days | Confidence: High
Upstream energy conditions are likely to continue improving faster than downstream affordability.
The critical confirmation signal is no longer Brent alone.
We need to see the improvement propagate simultaneously into:
refined-product margins → freight → insurance → wholesale fuel → end-user prices.
Until that happens, the system remains in partial rather than complete normalization.
26. Scenario Matrix
Scenario A — Uneven Normalization
Probability: 50%
Crude supply continues recovering and Hormuz conditions improve gradually, but refining, shipping and insurance constraints persist.
Oil benchmarks fall faster than delivered costs.
This is the current base scenario.
Implication: headline inflation pressure gradually improves, but households and businesses experience relief with a significant delay.
Scenario B — Broader Physical Normalization
Probability: 20%
Hormuz traffic improves materially, Yanbu exports normalize, refined-product supply recovers and shipping premiums begin falling.
The normalization process propagates through several layers simultaneously.
Implication: the energy shock begins genuinely reversing rather than merely migrating.
Scenario C — Constraint Migration
Probability: 20%
Crude availability improves but intervention in diesel, shipping or trade creates new distortions.
Scarcity shifts between fuels, jurisdictions or transport channels.
Implication: benchmark prices become increasingly poor indicators of actual operating costs.
Scenario D — Renewed Regional Escalation
Probability: 10%
New attacks materially disrupt Gulf or Red Sea infrastructure and reverse part of the current physical recovery.
Implication: markets rapidly restore the geopolitical premium while already-elevated downstream costs rise further.
The scenario probabilities describe analytical possibilities, not certainty. The key discriminator over the next two weeks is whether physical recovery propagates beyond crude into refined products and logistics.
27. Recommendations
Individuals
Do not translate lower crude prices directly into lower household expenditure assumptions.
If crude benchmarks continue falling but retail fuel, transport, utilities and food prices do not follow, maintain the existing energy and transport buffer through at least the end of September.
The relevant signal is not the commodity benchmark.
It is the price you actually pay.
Trigger: crude materially below its recent peak while retail and transport costs remain sticky.
Action: keep current household fuel and transport budget unchanged until end-user prices confirm the improvement.
Time horizon: 1–4 weeks.
Reversibility: High.
Business
Recalculate exposure using delivered cost, not commodity price.
A company may see cheaper crude while continuing to pay higher diesel, freight, insurance and financing costs. Removing redundancy because the headline benchmark improved could therefore recreate the vulnerability that the backup system was designed to solve.
Trigger: commodity benchmark declines while freight, insurance or refined-product costs remain more than 10% above the operating baseline.
Action: maintain backup suppliers and logistics routes and reassess them only after delivered costs normalize.
Time horizon: immediate through Q4 2026.
Reversibility: Medium.
For energy-intensive or logistics-heavy businesses, introduce a four-line monitoring dashboard:
Benchmark Price / Conversion Cost / Logistics Cost / Delivered Cost.
The fourth number should drive operating decisions.
Capital — Internal Decision Layer
Separate assets benefiting from falling geopolitical risk premiums from assets benefiting from persistent structural investment.
Those are not the same trade.
A temporary reduction in oil risk can pressure some crisis-sensitive positions while the underlying need for refining, grids, logistics, data centers, security infrastructure and regional manufacturing capacity remains intact.
The key distinction is:
cyclical shock premium versus structural adaptation expenditure.
The first can disappear quickly.
The second may persist for years.
28. Decision Intelligence Layer
The events of the last week now form a coherent sequence.
The system first absorbed the shock.
Then the bottleneck moved.
Then the cost moved.
Then the workaround became permanent.
Then financial markets began pricing normalization.
Now physical recovery has started — but it is not moving through the system evenly.
That gives us a more complete architecture:
Shock
→ Migration
→ Constraint
→ Adaptation
→ Capacity Expansion
→ Cost Allocation
→ Institutionalization
→ Uneven Normalization
→ New Baseline
The important addition is Uneven Normalization.
Recovery should not be modeled as the shock running backward.
It is its own transmission process.
A pipeline can reopen before tanker insurance normalizes.
Crude can become cheaper before diesel does.
Diesel can become cheaper before freight contracts reset.
Freight can normalize before supermarkets lower prices.
And consumer prices can stabilize while companies continue paying for the redundant infrastructure built during the crisis.
The recovery therefore moves through the system with its own delays, bottlenecks and feedback loops.
That changes the decision question.
During the shock, we asked:
Where will the constraint move next?
During adaptation:
Who will absorb the cost?
During normalization, the question becomes:
Which layer has actually recovered — and which one is merely being assumed to have recovered?
That distinction is increasingly important because financial markets can price the future faster than physical systems can deliver it.
A falling benchmark can therefore be true and misleading at the same time.
The benchmark may correctly signal that the probability of catastrophe has fallen.
It does not necessarily mean that the accumulated economic cost has disappeared.
The TIC Normalization Test
Before declaring a shock materially resolved, watch four levels:
1. Market Price
Has the financial risk premium fallen?
2. Physical Capacity
Have production, conversion and transport actually recovered?
3. Delivered Cost
Have freight, insurance, financing and intermediate-product costs normalized?
4. End-User Relief
Are households and businesses actually paying less?
On September 23, the answer is:
Market Price — improving.
Physical Capacity — improving slowly.
Delivered Cost — deteriorating.
End-User Relief — deteriorating.
That is not normalization.
It is the beginning of normalization in one part of the system while the accumulated shock continues moving through another.
And that may become one of the defining characteristics of the next phase of the global economy:
The crisis ends in markets first, in infrastructure second, and in everyday life last.
THRIVE IN CHAOS
Signal Over Noise
Daily analysis focuses on changes inside the current weekly regime. The Daily Chaos Index is indicative and does not replace the confirmed weekly series.
Join the newsletter
Be the first to read our articles.


